Search: Site This Page
(405) 360-1552

| Ecovac Services / Resources / Articles / |
Treatability Study for In-Situ Remediation of Subsurface Tetrachloroethene Contamination
1. INTRODUCTION
The Source Area at the Confidential Site has been determined to have concentrations of Tetrachloroethene (PCE) in excess of the intervention values in both soil and groundwater. The site is located in the city of Macon, Bibb County, Georgia.
A soil and groundwater investigation was conducted by Geotechnical & Environmental Consultants (GEC) in 2002 after two underground storage tanks were discovered during excavation for construction. An array of monitoring and injection wells have been installed to delineated the vertical and lateral extent of contamination in the vadose and saturated zones as shown on Figure 1.
EcoVac Services, Inc. (EcoVac) has provided Enhanced Fluid Recovery (EFR®) well testing services at the site in preparation for combined extraction of impacted groundwater and injection of chemical oxidants into the injection wells to facilitate in-situ chemical oxidation (ISCO) using a patented process called ISCO-EFR®. During the drilling of the injection wells, soil and groundwater samples were collected in the vadose and saturated zones for treatability analysis including soil oxidant demand (SOD) testing in both zones as well as treatability testing of the saturated zone soil and groundwater.
The results of these analyses are presented in this report and were used to calculate the amount of oxidant needed to overcome the natural SOD as well as fully mineralize the PCE, Trichloroethene (TCE), and cis-1,2-Dichloroethene (DCE). All of these contaminants of concern (COC) are included in the calculations presented herein due to their presence in the aquifer and the fact that the oxidants do not discriminate and will oxidize all organic compounds present.
2. PURPOSE AND SCOPE OF TREATABILITY STUDY
2.1. Problem Definition
Based on the data provided to EcoVac an area of treatment has been selected and targeted for ISCO-EFR® as shown on Figure 1. The treatment area is bounded on the west by Montpelier Avenue although the plume extends downgradient for some distance in a westerly direction.
The vadose zone above the water table has soil contamination that will be addressed by emplacing chemical oxidants into the four shallow injection wells designated IWS-1, 4, 5, and 8. The saturated zone will be addressed using the deep injection wells designated IWD-2, 3, 6, 9, 10, 11, 12 and MWA-3. The locations of these wells and the compliance wells are displayed on Figure 2. The compliance wells are designated MWA-1, MWA-2, MWR-3, MWB-4 and MWD-6. MWR-3 is a replacement compliance well for MWA-3 which was too shallow to be used for sampling but will instead be used as an injection well as listed above. The compliance wells will be extracted during the injections to draw the oxidants through the contaminated zones to accomplish in-situ remediation by oxidation of contaminants.
2.2. Objective
The objective of this treatability study is to determine the mass of contaminant present in the treatment area and the amount of oxidant required to overcome the natural SOD in the soil and treat the mass of the contaminant compounds present in the vadose and saturated zones. This includes volumetric and stoichiometric calculations based on the aerial extent of the contaminants and their concentrations combined with the vertical extent and the porosity (provided by GEC) to provide a calculation of the mass of contaminants to be treated.
The treatability tests and Soil Oxidant Demand (SOD) tests will be combined with the volumetric and stoichiometric calculations to provide a calculation of the mass of oxidant and activator needed to effectively remediate the contamination that exists in the source area. The treatability test will also confirm the appropriate oxidant concentration suitable and compatible to achieve the desired result.
3. CALCULATIONS
3.1. Volumetric Analysis
EcoVac has prepared iso-concetration contour maps of the groundwater analytical data collected by GEC in September of 2009 for each COC to determine the aerial extent of the various concentrations of PCE, TCE, and DCE. These maps are presented in this report as Figures 3, 4, and 5. This data provides a square footage for each contaminant which is combined with the vertical thickness of 6.33 feet to give a cubic foot value for each COC. This cubic foot value is then multiplied by the porosity value of 35.3% to yield a volume of groundwater in the treatment zone. The results of the volumetric analysis yield the following volumes of groundwater (in cubic feet) for each COC to be treated:
PCE Volume = 220,000
TCE Volume = 19,700
DCE Volume = 25,300
3.2. Stoichiometric Analysis
The volume of groundwater and the iso-concentration contour data are combined using the molecular weight of each contaminant to calculate the mass of each COC in the treatment zone. The molecular weight of PCE is 165.6 grams per mole (g/mol), of TCE is 131.2 gm/mol, and 1-2 DCE is 96.8 gm/mol. Integrating this data the mass of each COC to be treated (in grams) is as follows:
PCE Mass in Groundwater = 576
TCE Mass in Groundwater = 81
DCE Mass in Groundwater = 21
Having determined the mass of each COC and knowing the Stoichiometric Requirements for Complete Mineralization by Sodium Persulfate from Table 1, the COC oxidant demand can be calculated.
Table 1: Stoichiometric Requirements for Mineralization by Sodium Persulfate.
|
Target Compound |
Compound Molecular Wt. (g/mol) |
Oxidant Demand (g S2O82-/g of target) |
|
Tetrachloroethene |
165.6 |
2.9 |
|
Trichloroethene |
131.2 |
5.4 |
|
Dicholorethene |
96.8 |
9.8 |
The results of these calculations yield the amount of persulfate needed to treat the each of the three contaminants as follows ( in grams):
Mass of Persulfate to Mineralize PCE = 1,670
Mass of Persulfate to Mineralize TCE = 437
Mass of Persulfate to Mineralize DCE = 206
The total amount of persulfate required to treat the entire source area target zone plume is merely 2,313 grams (2,867 grams as sodium persulfate); however, please note these values are based on the stoichiometic requirement only; the actual demand of persulfate will be determined through the following treatability studies.
4. SOD TESTING RESULTS SUMMARY
Soil Oxidant Demand (SOD) Tests were run on three Shelby Tube samples collected by GEC during the drilling and installation of injection wells. Two samples from the source area were tested because hydrocarbon odors were detected at IWS-1 during drilling in a location where it is believed a gas station once existed. The other source area location tested was IWS-4 which is representative of the lithology at the same depth in the vadose zone but without the hydrocarbon organics in the sample. Both of these vadose zone samples from IWS-1 and 4 were collected from a depth of 14-17 feet below ground surface (BGS).
Although the depth of collection was the same, the sample from IWS-1 was very sandy and the one from IWS-4 had more clay and silt fractions. SOD results (Table 2) show that the sample from IWS-1 (which had a strong hydrocarbon odor indicating organic hydrocarbon contamination) had a lower SOD than the sample tested at the same depth at IWS-4. This result is a function of the lithologic variation such that the clay at IWS-4 created more demand than the hydrocarbons in the sandy sample at IWS-1.
In the saturated zone one sample was tested for SOD at injection well location IWD-9 at a depth of 46 to 49 feet BGS which is at the top of the saturated zone. The depth to water at well IWD-9 prior to pilot testing was 47.75 feet.
The SOD study determines the amount of persulfate naturally consumed with existing soil as well as through auto-decomposition. Four (4) different persulfate concentrations (1,000, 5,000, 10,000, and 20,000 mg/L) were tested for SOD measurement. One of these concentrations is potentially used as a design concentration, which represents minimum effective concentration at a boundary of injection radius of influence (ROI).
The SOD values were experimentally determined and shown on Table 2 as follows:
Table 2: SOD Test Results
|
Vessel ID |
Soil Used |
Soil Wt. (g) |
GW Vol. (ml) |
Initial Na2S2O8 (mg/L) |
Final Na2S2O8 (mg/L) |
SOD (mg/kg) |
Minimum Na2S2O8 (mg/L) |
|
2-A |
IWS-1 |
40 |
200 |
1,000 |
536 |
232 |
1,300 |
|
2-B |
IWS-4 |
40 |
200 |
1,000 |
357 |
322 |
1,800 |
|
2-C |
IWD-9 |
40 |
200 |
1,000 |
714 |
143 |
810 |
|
3-A |
IWS-1 |
40 |
200 |
5,000 |
4,170 |
418 |
2,400 |
|
3-B |
IWS-4 |
40 |
200 |
5,000 |
4,110 |
447 |
2,500 |
|
3-C |
IWD-9 |
40 |
200 |
5,000 |
4,170 |
418 |
2,400 |
|
4-A |
IWS-1 |
40 |
200 |
10,000 |
8,970 |
388 |
2,200 |
|
4-B |
IWS-4 |
40 |
200 |
10,000 |
7,540 |
924 |
5,200 |
|
4-C |
IWD-9 |
40 |
200 |
10,000 |
8,806 |
448 |
2,500 |
|
5-A |
IWS-1 |
40 |
200 |
20,000 |
17,300 |
686 |
3,900 |
|
5-B |
IWS-4 |
40 |
200 |
20,000 |
15,000 |
1,250 |
7,100 |
|
5-C |
IWD-9 |
40 |
200 |
20,000 |
17,600 |
597 |
3,400 |
The average SOD values were determined to be 431, 736, 409 mg/kg for the soils collected from IWS-1, IWS-4, and IWD-9, respectively. Based on the highest SOD value, the design concentration of sodium persulfate was selected to be10,000 mg/L. The details of persulfate analysis and quality assurance sheets are included as Appendix A. The highest demand of persulfate was observed in Vessel 5-B (1,250 mg/kg) and minimum required concentration of persulfate to meet the demand was approximately 7,100 mg/L; therefore, the design concentration of persulfate (10,000 mg/L) should comfortably satisfy both demand for the highest SOD and complete mineralization of COC in the treatment zones.
5. TREATABILITY TESTING RESULTS SUMMARY
The results of the Treatability testing are presented in three sections as follows. The first section describes the criterion used to select the oxidant and the activator. The second section describes the Treatability methodology used for the SOD and Treatability studies. The third section presents the results of these tests.
5.1. Oxidant/Activator Selection
The selection of the oxidant and the activator are based on a number of factors which must be considered to achieve the desired result when implemented in the field. The primary factors to be considered are the Kinetics, the Stoichiometry and the Thermodynamics. These factors control the rate of the oxidative reactions (i.e. the length of time the oxidant remains active in the aquifer), the oxidative chain reactions which occur as the PCE is converted to TCE and DCE which are also oxidized, and finally the laboratory simulation provided by the Treatability study to confirm the Gibbs Free Energy will cause the reactions to occur and reach the desired endpoint.
Several oxidants and activators have been considered in this analysis. For the oxidants the choices were Sodium Persulfate with Iron EDTA , Hydrogen Peroxide, and Permanganate. Hydrogen Peroxide is a good oxidant but is kinetically too fast to allow time to be distributed and come in contact with the targeted compounds (especially Fentons reagent). Permanganate is a good oxidant but is unfavorable in fine grained formations such as exists at this site because the reaction causes the precipitation of manganese oxide which has been shown to reduce the effective porosity of such formations. This is undesirable because multiple ISCO injections are typically necessary to emplace the full volume of oxidant required to completely mineralize the target compounds and any reduction in effective porosity will negatively affect subsequent injections or remedial alternatives.
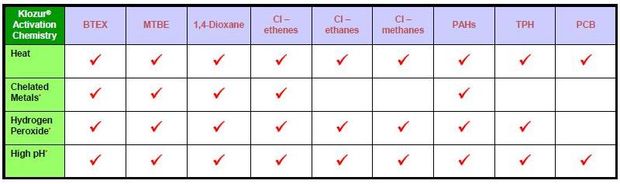
Based on these facts and the demonstrated effectiveness of Activated Persulfate Chemistries on the specific compounds present at this site (Table 3), it is the preferred oxidant for this purpose. The sodium persulfate has been demonstrated to be active in-situ for up to and beyond 90 days which is preferable to allow time to contact the target compounds. Further, the sodium persulfate has a higher aqueous solubility than potassium permanganate which allows for higher concentrations to be used.
The activators shown on Table 3 to be effectively used to treat chlorinated ethenes such as are present on this site include Iron EDTA, Sodium Hydroxide (high pH), Hydrogen Peroxide or heat. EcoVac has experience with all of these activators and unless subsurface utilities in the target zone are a concern generally use Iron EDTA because it is much safer to transport and handle than the other two and does not have the potential to cause precipitation which can also occur with the use of NaOH.
Laboratory data provided to EcoVac by the manufacturer (FMC Corporation) indicate the Iron EDTA activated Sodium Persulfate is highly effective in treating PCE, TCE and DCE as well as BTEX.
Table 3: Effectiveness of Activated Persulfate Chemistries
5.2. Treatability Methodology
5.2.1. SOD Study
Four different concentrations of persulfate (1,000, 5,000, 10,000 and 20,000 mg/L) were arbitrary used to conduct SOD study. One of these concentrations is potentially used as a design concentration. The lowest concentration (1,000 mg/L) was devised through analyzing historical groundwater and soil data. The details of the reasoning was described as follows:
Demand in Aqueous Phase
A. Tetrachloroethylene (PCE)
Direct Oxidation of Persulfate
S2O8-2 + 2H+ 2e- → 2HSO4-
MW of S2O8-2 = 192.14
# of Electrons transferred = 2
C2Cl4 + 4H2O → 2CO2 + 4Cl- + 8H+ + 4e-
MW of PCE = 165.80
# of Electrons transferred = 4
Although the highest historical PCE concentration was detected as 1,200 ug/L in monitoring well MWA-1 (January 2008), the collected groundwater was amended with neat PCE to increase the minimum concentration at 100,000 ug/L. The reason for the PCE amendment is to assess the effectiveness of the oxidant in more quantifiable manner. Based on the minimum PCE concentration, stoichiometric demand of persulfate for complete mineralization is 232 mg/L.
B. Trichloroethylene (TCE)
Direct Oxidation of Persulfate
S2O8-2 + 2H+ 2e- → 2HSO4-
MW of S2O8-2 = 192.14
# of Electrons transferred = 2
HC2Cl3 + 4H2O → 2CO2 + 3Cl- + 9H+ + 6e-
MW of TCE = 131.35
# of Electrons transferred = 6
The highest historical TCE concentration was 400 ug/L and it was observed from monitoring well MWA-1 in February 2008. Based on the highest historical TCE concentration, stoichiometric demand of persulfate for complete mineralization is 1.76 mg/L.
C. Total Dichloroethylenes (DCE)
Direct Oxidation of Persulfate
S2O8-2 + 2H+ 2e- → 2HSO4-
MW of S2O8-2 = 192.14
# of Electrons transferred = 2
H2C2Cl2 + 4H2O → 2CO2 + 2Cl- + 10H+ + 8e-
MW of DCE = 96.90
# of Electrons transferred = 8
The highest historical DCE concentration was 190 ug/L and it was observed from monitoring well MWA-1 in February 2008. Based on the highest historical DCE concentration, stoichiometric demand of persulfate for complete mineralization is 0.76 mg/L.
D. Benzene
Direct Oxidation of Persulfate
S2O8-2 + 2H+ 2e- → 2HSO4-
MW of S2O8-2 = 192.14
# of Electrons transferred = 2
H6C6 + 12H2O → 6CO2 + 30H+ + 30e-
MW of Benzene = 78
# of Electrons transferred = 30
The highest historical benzene concentration was 190 ug/L and it was observed from monitoring well MW-1 in October 2002. Based on the highest historical Benzene concentration, stoichiometric demand of persulfate for complete mineralization is 2.85 mg/L.
E. Toluene
Direct Oxidation of Persulfate
S2O8-2 + 2H+ 2e- → 2HSO4-
MW of S2O8-2 = 192.14
# of Electrons transferred = 2
H8C7 + 14H2O → 7CO2 + 36H+ + 36e-
MW of Toluene = 92
# of Electrons transferred = 36
The highest historical toluene concentration was 510 ug/L and it was observed from monitoring well MW-1 in October 2002. Based on the highest historical Toluene concentration, stoichiometric demand of persulfate for complete mineralization is 9.18 mg/L.
F. Ethylbenzene
Direct Oxidation of Persulfate
S2O8-2 + 2H+ 2e- → 2HSO4-
MW of S2O8-2 = 192.14
# of Electrons transferred = 2
H10C8 + 16H2O → 8CO2 + 42H+ + 42e-
MW of Ethylbenzene = 106
# of Electrons transferred = 42
The highest historical ethylbenzene concentration was 130 ug/L and it was observed from monitoring well MW-1 in October 2002. Based on the highest historical Ethylbenzene concentration, stoichiometric demand of persulfate for complete mineralization is 2.73 mg/L.
G. Xylenes
Direct Oxidation of Persulfate
S2O8-2 + 2H+ 2e- → 2HSO4-
MW of S2O8-2 = 192.14
# of Electrons transferred = 2
H10C8 + 16H2O → 8CO2 + 42H+ + 42e-
MW of Xylenes = 106
# of Electrons transferred = 42
The highest historical xylenes concentration was 470 ug/L and it was observed from monitoring well MW-1 in October 2002. Based on the highest historical Xylene concentration, stoichiometric demand of persulfate for complete mineralization is 9.87 mg/L.
By summing each oxidant demand, 259.15 mg/L of persulfate is required for eliminating each contaminant from aqueous phase. This conservative approach merely requires approximately quarter of minimum design concentration (1,000 mg/L) in order to mineralize each contaminant in the groundwater.
Demand from Soil
Most historical soil analyses indicate negligible amount of contaminant concentrations in soil. However, the concentration of total organic carbon (TOC) has been exceeded above 20 mg/L in the most contaminated zone. It is expected some portions of oxidant are consumed at a contact with natural and/or anthropogenic carbon sources. The design concentration of persulfate must exceed the minimum required persulfate concentration to overcome the SOD and contaminant demand.
SOD value is not identical to the minimum concentration of persulfate. The minimum required persulfate concentration to meet the SOD was obtained as follows:
Treatment Volume for ROI (V) = R2 x π x H
Treatment Soil Weight for ROI (Wsoil) = V x (Soil Density)
One Pore Volume (1 PV) = V x (Effective Porosity)
Mass of Persulfate to satisfy SOD (Wpersulfate) = SOD x Wsoil
Minimum Required Persulfate Concentration = Wpersulfate / 1 PV
Please note that input values are:
R = 30 feet
H = 6.33 feet
Soil Density = 2 g/cm3
Effective Porosity = 35.3%
SOD = 1,250 mg/kg (the highest among the samples – Vessel 5- B)
The minimum required concentration of sodium persulfate based on the highest SOD (1,250 mg/kg) was calculated to be 7,100 mg/L.
Design Concentration ≥ (Wpersulfate / 1 PV) + Stoichiometric Demand
Design Concentration = 10,000 mg/L > 7,100 + 259 mg/L = 7,359 mg/L
Thus, the design concentration was determined to be 10,000 mg/L. Additionally, it is suggested that the activator (FeEDTA) concentration at a boundary of ROI needs to exceed 1,154 mg/L. During the batch reaction treatability study, the most appropriate activator concentration will be determined.
SOD Study Experimental Procedures
The experimental procedure is summarized as follows:
This section is not shown due to the proprietary nature of its contents.
5.2.2. Batch Reaction Treatability Study
Persulfate oxidation chemistry is an emerging technology for in-situ chemical oxidation of chlorinated organics. Activation of persulfate to form sulfate radicals is a potent tool for the remediation of a wide variety of contaminants, including the primary contaminant (PCE) at this site. The objective of the batch reaction study is 1) to investigate whether the design concentration of the oxidant, which is the minimal effective concentration of persulfate determined through the SOD study, satisfactorily abates COCs at a boundary of ROI, 2) to assess optimal activator concentration, and 3) to assess any presence of unanticipated reaction due to the use of the oxidant (e.g. unusual temperature increase, and precipitate formation at an injection well).
Injectate Concentration Design
The concentration of injecting persulfate concentration is determined as follows:
C1V1 = C2V2
where,
C1 = concentration of injecting persulfate concentration
V1 = volume of injecting persulfate solution
C2 = design concentration; oxidant concentration at a boundary of ROI
V2 = one pore volume to fill ROI
Based on the assumptions shown below,
V2 = 47,300 gallons
V1 = 1,580 gallons (may be divided into multiple injection events)
Then,
C1 ≈ 30%
Assumptions
- Through the pilot test conducted on December 2009, ROI was determined to be 30 feet.
- Vertical treatment thickness is 6.33 feet.
- Effective porosity of the most contaminated zone is 35.3%.
- Through the SOD study, design concentration of oxidant is 10,000 mg/L.
- The activator (FeEDTA) concentrations are optimal at 3.6 and 7.2% (1,200 and 2,400 mg/L at the design concentrations, respectively).
The minimum persulfate concentration necessary to meet average SODs for three soil samples (IWS-1 for 431, IWS-4 for 736, IWD-9 for 409 mg/kg) and stoichiometric demands are approximately 2,700, 4,400, and 2,600 mg/L, respectively. None of the samples exceeds the total demand above 5,000 mg/L. The design concentration at 10,000 mg/L may be perceived as overly conservative, and 5,000 mg/L may be enough to meet the total demands (in the circumstance, the volume of injectate may be reduced to half); however, EcoVac recommends the conservative approach to take into account safety factors and to make sure complete mineralization of COCs occurs, even in the most demanding zones. The injectate volume will be divided into a series of three separate injection events in February and March of 2010 followed by a groundwater sampling event by GEC no sooner than 90 days after the final injections to allow the oxidation reactions to reach completion.
Through the batch reaction study, the following data were collected:
- PCE degradation over 15 days with design concentration (10,000 mg/L)
- The most appropriate and effective activator concentration
- Longevity of persulfate in injectate mixture
- Temperature increase while preparing the injectate concentration
Batch Reaction Treatability Study Procedures (for 1 and 2 above)
This section is not shown due to the proprietary nature of its contents.
Injectate Batch Reaction Test Procedure (for 3, and 4)
This section is not shown due to the proprietary nature of its contents.
5.3. Treatability Results
The following sections present the results of the Treatability Study.
5.3.1 Oxidant Effectiveness
After 15 days of incubation/reaction in ambient temperature, percent reductions in PCE were compared with initial baseline conditions. Concentrations of DCEs, and TCE were reported below reporting limit (BRL) in all samples. The concentration of PCE in baseline condition was reported as 17,000 ug/L. The concentrations of PCE in Control, Reaction I and Reaction II Vessels (after 15 days of reaction) were reported as 10,000, 6.6 and <5.0 ug/L, respectively. Thus, the percent reductions in Control, Reaction I, and Raction II Vessels, were found 41.2, >99.9, and >99.9%. Comparison of the 15-day reduction trend is exhibited in the figure below:
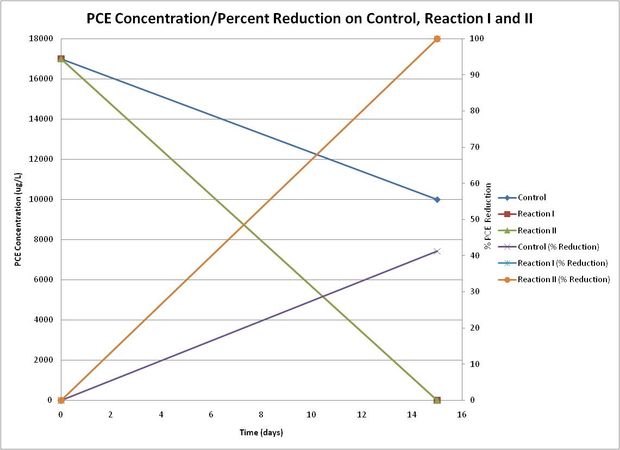 Figure 6 - Reduction of PCE Concentration Over Time-Controls vs. Reaction Vessels
The following observations were noted through the batch 15-day reaction test:
1) Excellent destruction of COCs was achieved in Reaction Vessel I and II; more than 99% of PCE was destroyed in 15 days.
2) Activator concentration did not make significant increase in the contaminant destruction rate.
The samples during this investigation were analyzed by Analytical Environmental Services, Atlanta GA (AES) for VOCs using EPA Method 8260B. AES analytical data and chain of custody are included as Appendix B.
Thus, the design concentrations of the oxidant (i.e., persulfate 10,000 mg/L and FeEDTA 1,200 mg/L) would sufficiently abate the COCs in groundwater at the site.
5.3.2. Injectate Stability
Neither precipitation nor unusual temperature increase was observed during the injectate mixing for both 30% persulfate with 3.6% FeEDTA and 30% persulfate with 7.2% FeEDTA. A small amount of FeEDTA particles could not be completely dissociated in 5 minutes of mixing; as a result, it is suggested that the injection fluid in the mixing tank should be continuously agitated while the fluid is transferred to injection wellheads in order to prevent the particles from settling in the bottom of the mixing tank.
The maximum temperature increase during the mixing was 3.9 degree Celsius. It is unlikely we will encounter volatile and violent reaction at injection wellheads. When 30% persulfate was mixed with the activator, the solution did not exhibit any volatile reaction; the mixture remained stable. Dissipation of persulfate over 24 hours is presented on Figure 7A and Figure 7B:
Figure 7A: Injectate Persulfate Concentration with 3.2% FeEDTA over Time
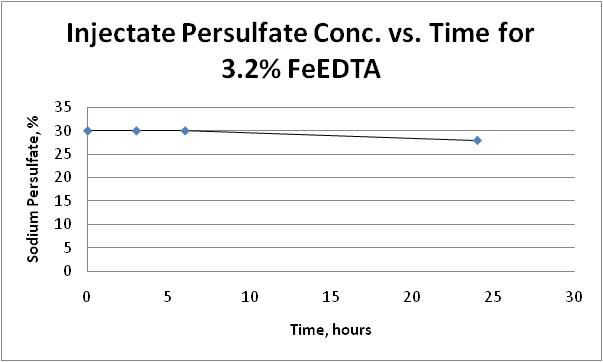
Figure 7B: Injectate Persulfate Concentration with 7.2% FeEDTA over Time
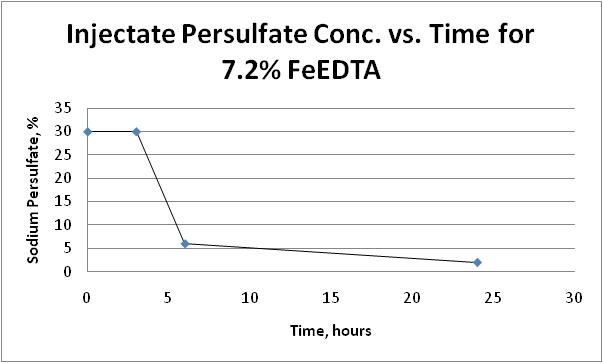
With 7.2% FeEDTA, more than 80% of sodium persulfate dissipated in 6 hours; whereas, only 7% of persulfate was dissipated after 24 hours with 3.2% FeEDTA. When 1,200 mg/L FeEDTA is used as design concentration, the life of injectate is significantly longer; thus, it will be easier to handle during the field implementation.
6. DATA ANALYSIS
Based on the most conservative SOD (1,250 mg/kg / Vessel ID = 5-B), design concentration of sodium persulfate was determined as 10,000 mg/L. During the batch reaction test, effectiveness of the design concentration (10,000 mg/L) was evaluated with two different activator (FeEDTA) concentrations (1,200 and 2,400 mg/L). Both of these combinations destroyed the contaminant (PCE) more than 99.9% in 15 days. Finally, injectate batch formulation was assessed based on the persulfate and two activator design concentrations. When 1,200 mg/L FeEDTA was utilized as activator design concentration, percent dissipations of persulfate in the mixture after six (6) and 24 hours were found zero (0) and 6.7%, respectively. On the contrary, when 2,400 mg/L FeEDTA was utilized, percent dissipations after six (6) and 24 hours were found 80.0 and 93.3%, respectively.
7. CONCLUSIONS
Based on the above analysis, the most effective oxidant formulation was determined as follows:
Design Concentration of Sodium Persulfate = 10,000 mg/L
Design Concentration of FeEDTA = 1,200 mg/L
The following injectate design will yield the above design concentrations at 30 feet ROI based on the effective porosity (35.3%) and treatment depth (6.33 feet):
Injectate Volume per 30 feet ROI = 1,600 gallons
Injectate Concentration of Sodium Persulfate = 30%
Injectate Concentration of FeEDTA = 3.2%
Through this injection design, approximately 47,000 gallons of groundwater will be treated, with more than 99.9% of contaminants destroyed under the most conservative conditions.
The Figures and Appendices have been deleted from this copy due to the confidential nature of this client and site.